Project Books
04 · POWER BI · DAX · FINANCIAL ANALYTICS
Grant Financial Analytics & Reporting Dashboards
Overview
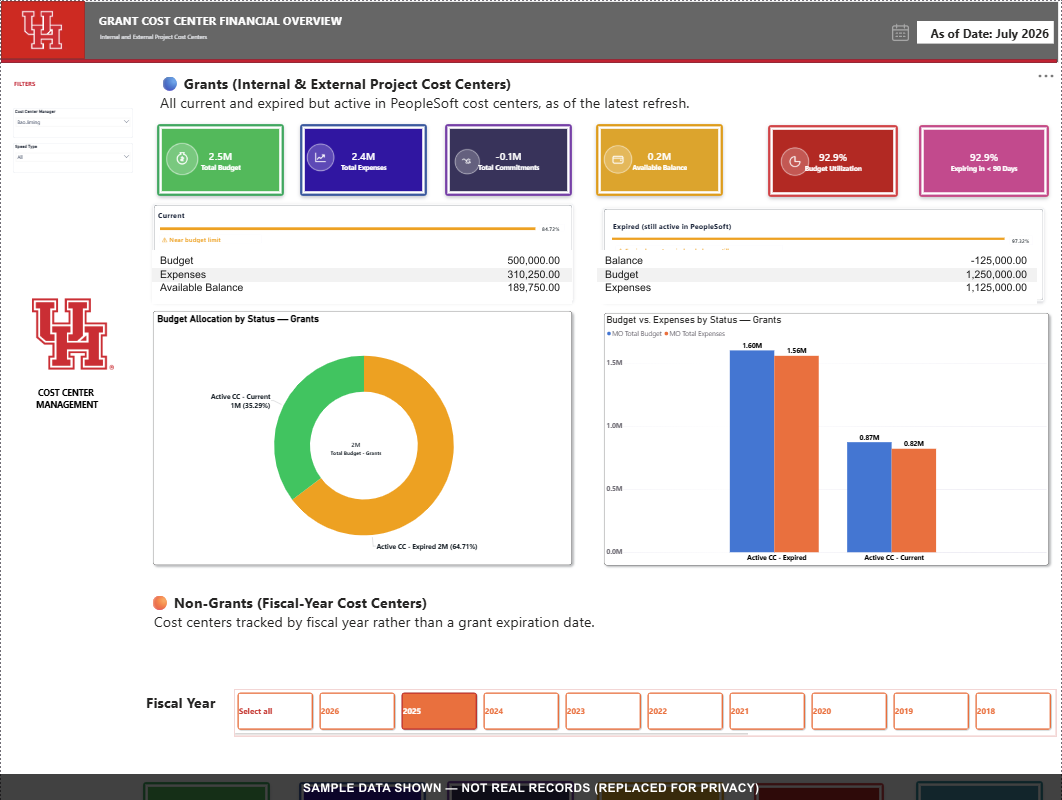
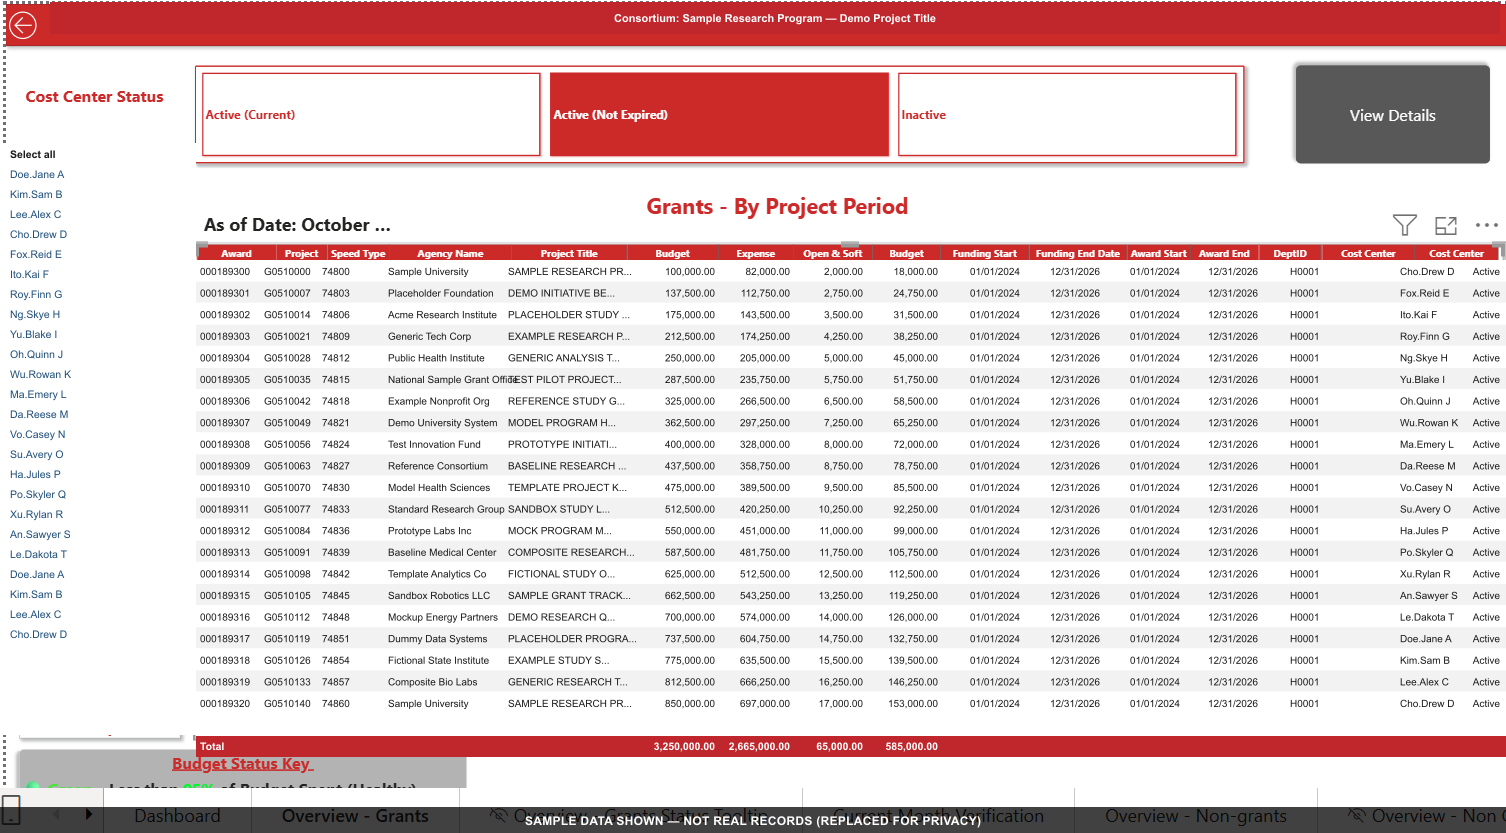
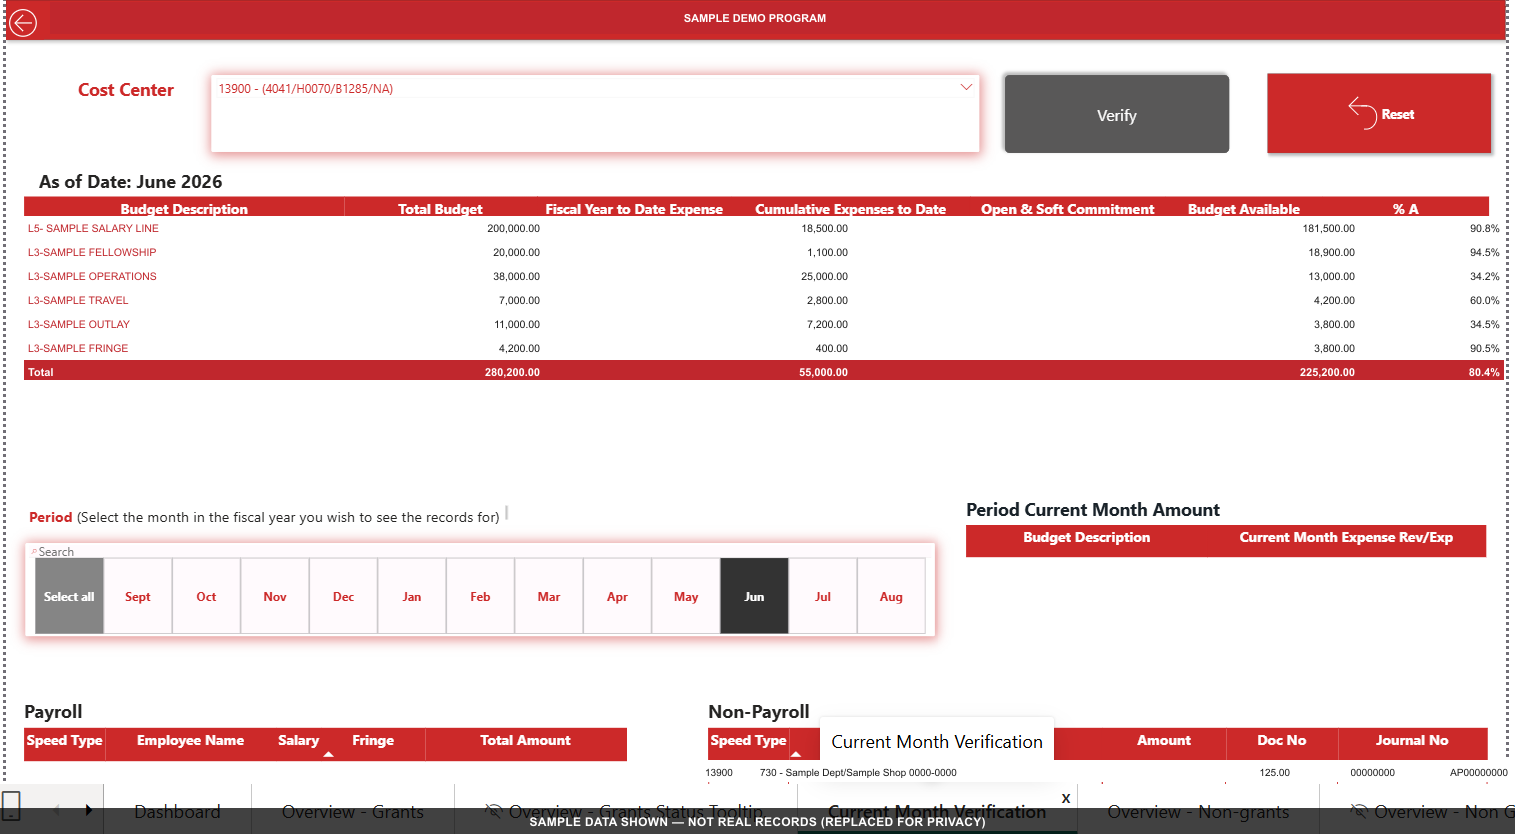
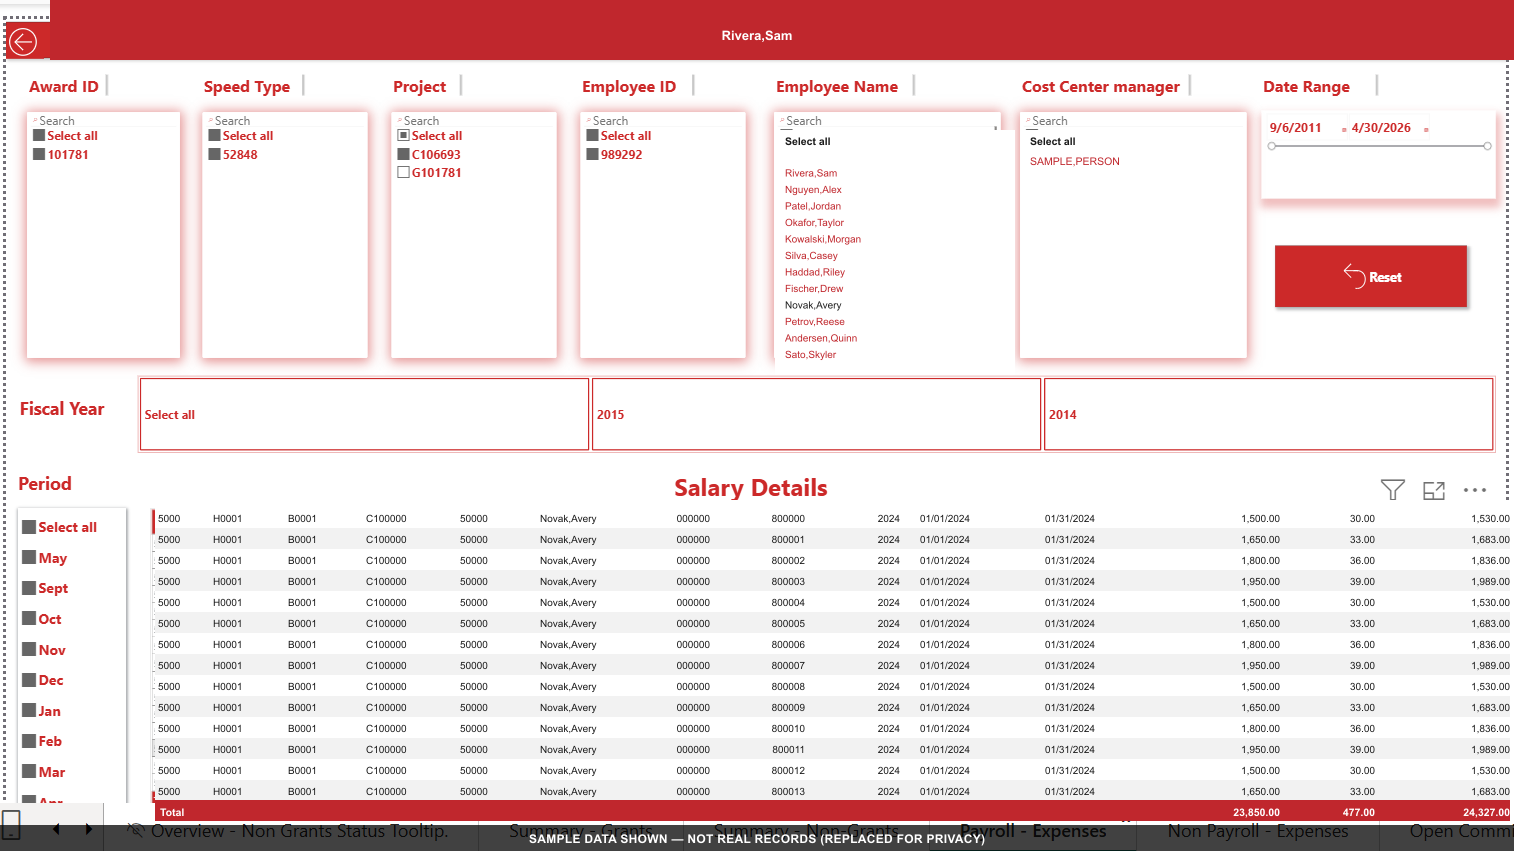
Built a centralized Power BI reporting system for grant and cost-center review, with a Databricks data-processing layer that automated a preparation process which used to take two days. One data model with DAX measures and Power Query transformations sits behind a grant overview, current-month verification, and payroll / non-payroll drilldowns.
Details
Key result1,074 — recurring reports automated
Stack
Power BIDatabricksDAXPower QueryPythonSQLPeopleSoft
1,074reports automated
50%manual work reduced
11+departments
10+dashboard views
Evidence note — sample data
The dashboards below are real — every figure, name, and ID shown in them has been replaced with fabricated sample data. The actual grant, financial, and employee records are private and are not shown.