Folio — EditionSakina Saifuddin© 2026
2021

A journey through code, data, and intelligent systems.

Folio — EditionSakina Saifuddin© 2026
SS
01Intro02Work03What I Build04Achievements05Experience06Expertise07Contact
Case studyClick a page, swipe, or use ← → to turn

POWER BI GRANTFINANCEDASHBOARDS

GRANT DASHBOARDS

  • Replaced 1,074 recurring reports with one Power BI system.
  • Databricks now prepares the data automatically.
  • Reviewers go from the grant overview down to single transactions.
1,074reports replaced
2 days → autodata preparation
Visit the portfolio
website at:
sakina-saifuddin / works
36776
Grant DashboardsSakina Saifuddin

POWER BI GRANTFINANCEDASHBOARDS

One place to review grant finances
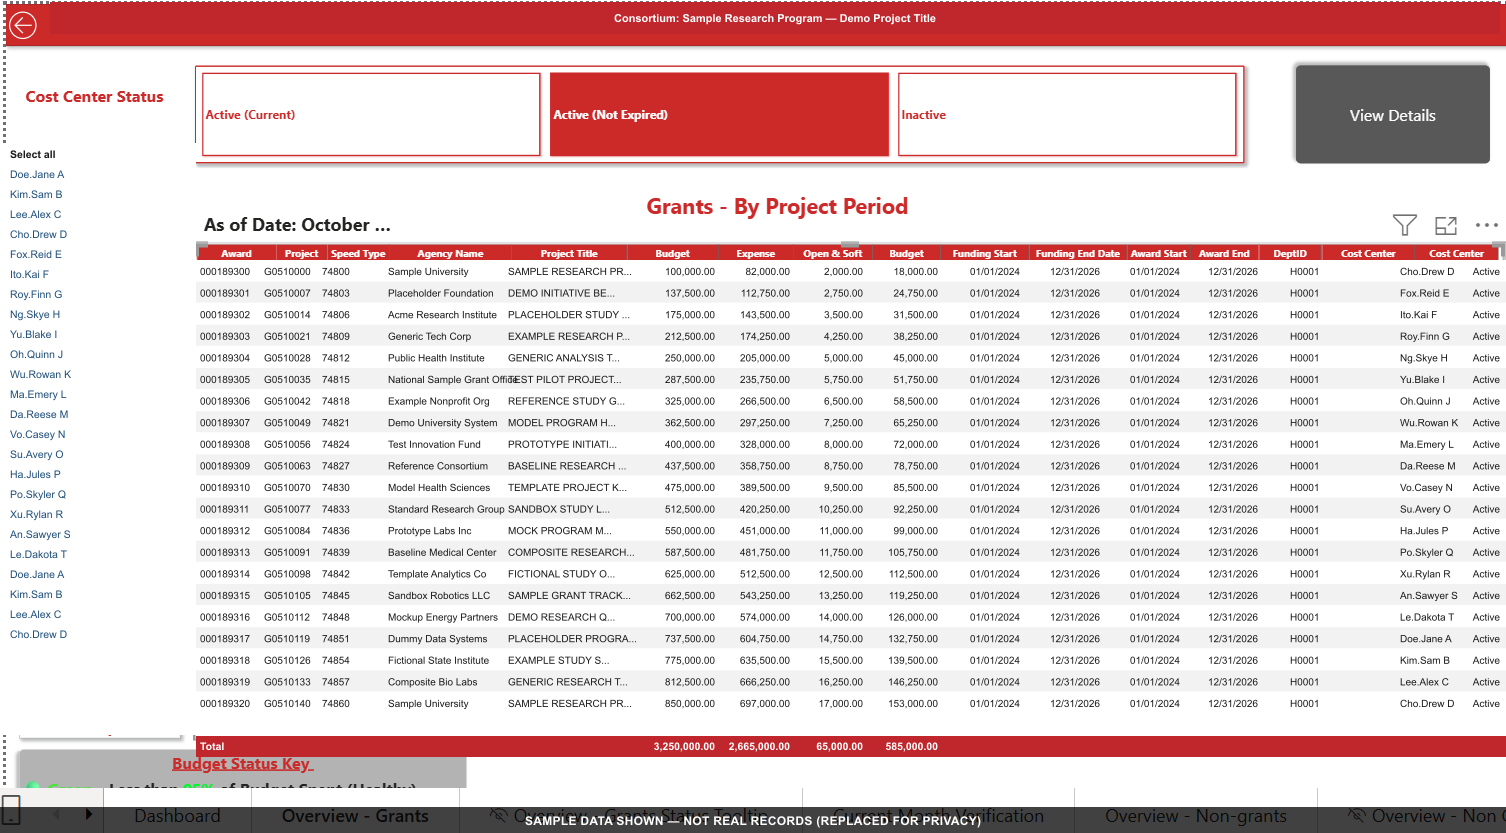
Fig. 1 — Grant overview (sample data).1
  1. Task
  2. My work
  3. Results
  4. Outcome

One place to review grant finances

  • Managers read hundreds of separate recurring reports.
  • Budget, expenses, commitments and payroll lived in different places.
  • Preparing the data by hand took about two days.
1,074separate recurring reports
2
Automated data processing with Databricks
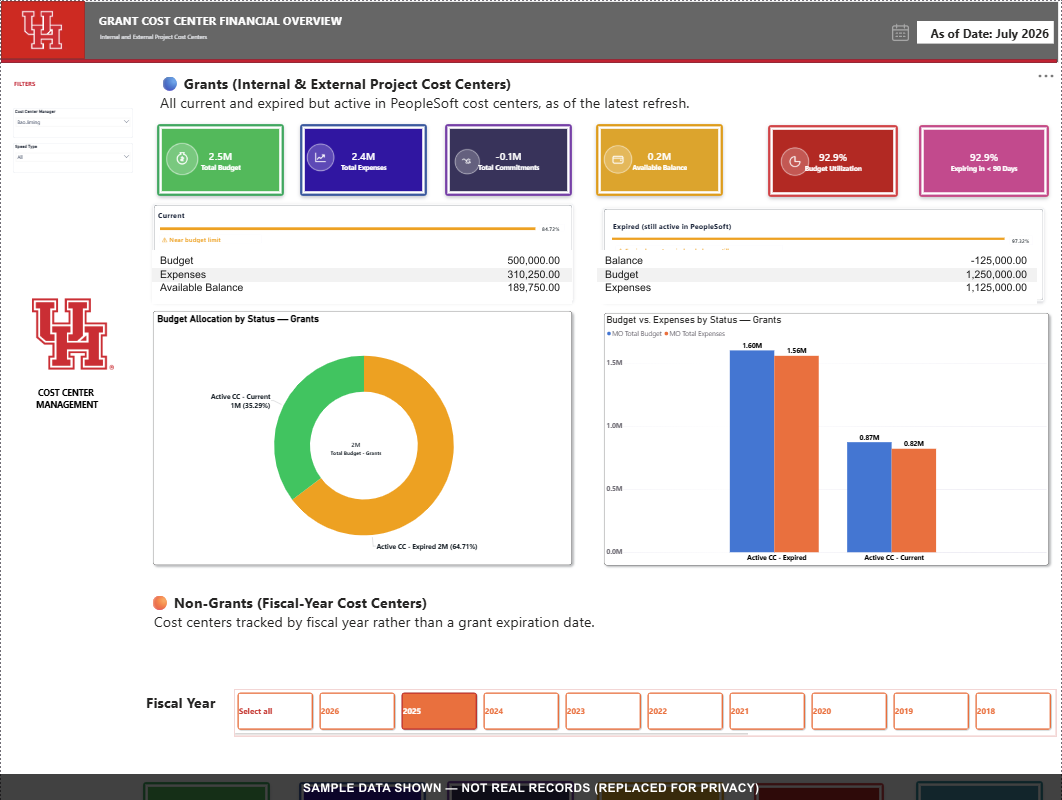
Fig. 2 — Budget vs. expenses by status (sample data).3
  1. Task
  2. My work
  3. Results
  4. Outcome

Automated data processing with Databricks

  • Added a Databricks layer that prepares all the financial data.
  • It replaced a manual process that took two days.
  • The dashboards always receive clean, consistent data.
2 days → autodata preparation time

Tools: Databricks · Python · SQL

4
One model, summary to transaction
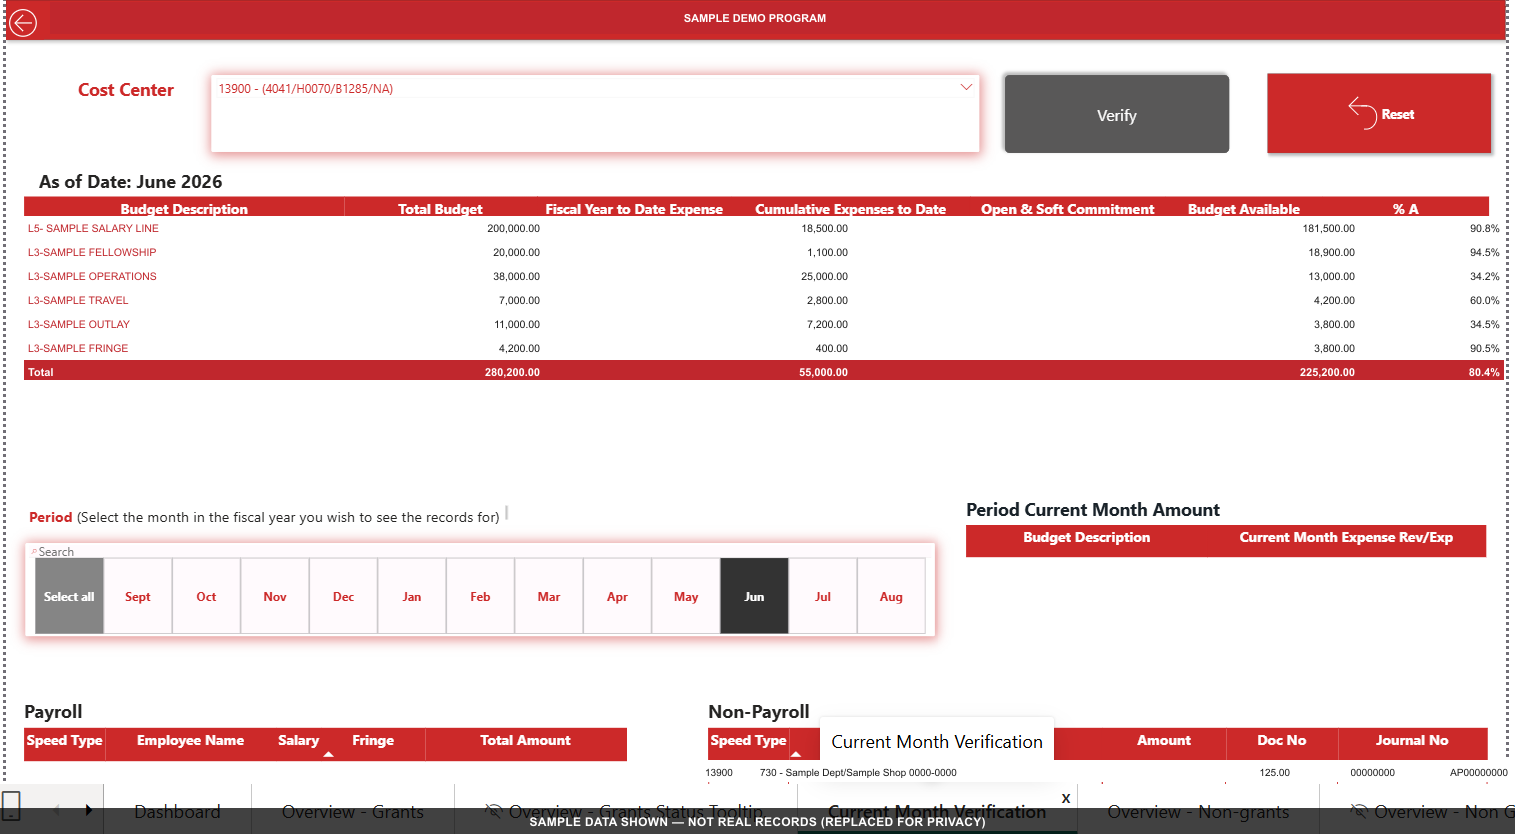
Fig. 3 — Monthly review for one cost center (sample data).5
  1. Task
  2. My work
  3. Results
  4. Outcome

One model, summary to transaction

  • Lined up budget, commitments, payroll and fiscal periods.
  • Wrote DAX measures and Power Query steps for every total.
  • Built overview, monthly review and payroll drilldown screens.

Tools: Power BI · DAX · Power Query

6
Reporting automated across the college
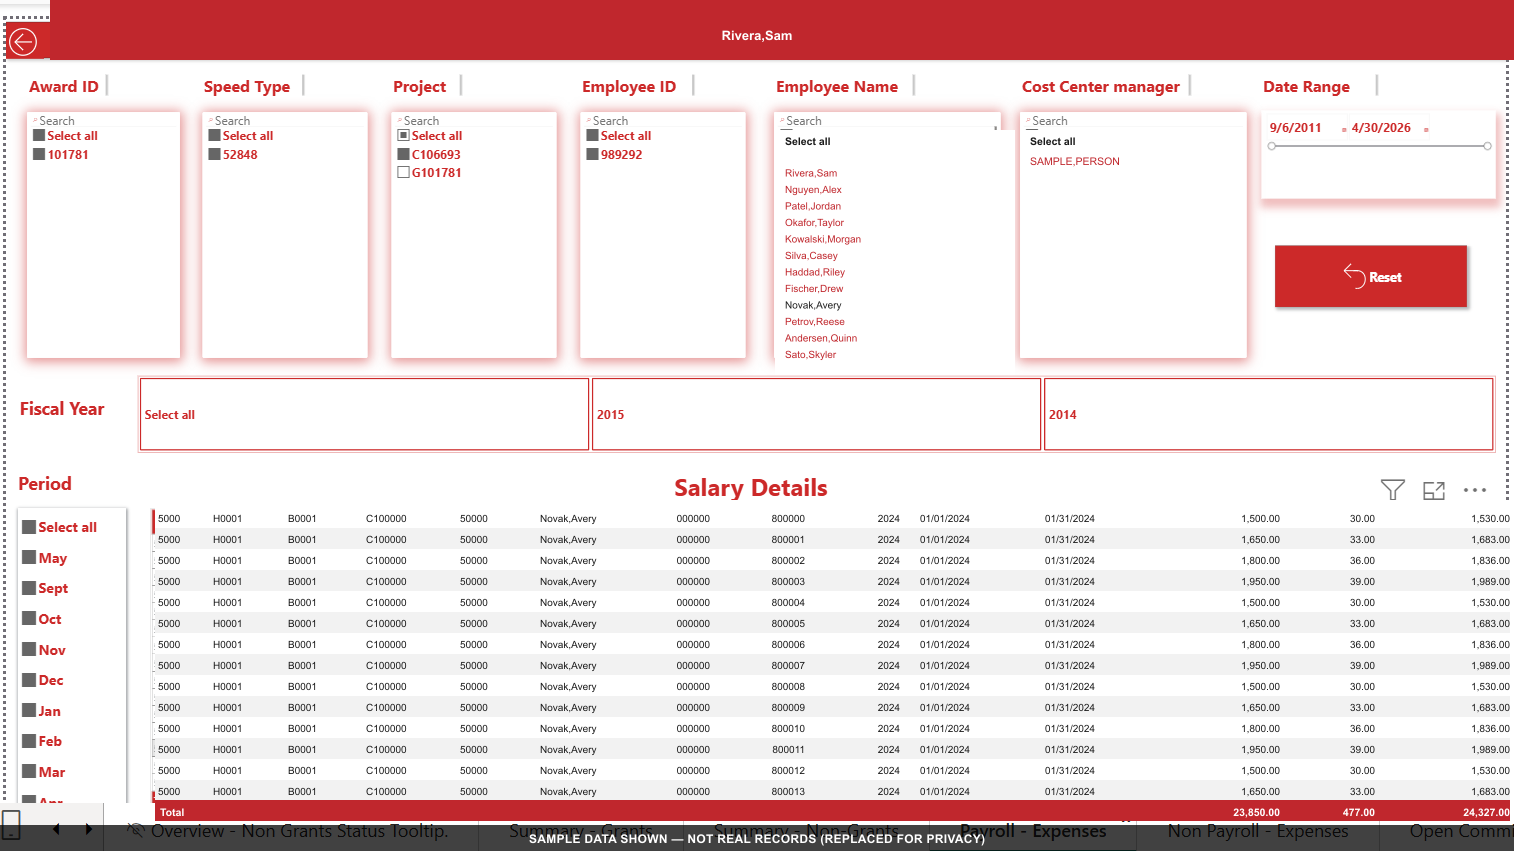
Fig. 4 — Payroll drilldown (sample data).7
  1. Task
  2. My work
  3. Results
  4. Outcome

Reporting automated across the college

1,074reports replaced
50%less manual review work
11+departments supported
50+grants and datasets
8
No more jumping between files
Fig. 5 — All figures are sample data.9
  1. Task
  2. My work
  3. Results
  4. Outcome

No more jumping between files

  • Data arrives prepared, with no two-day manual step.
  • Reviewers drill from overview to exact transactions.
  • The dashboards also feed the Cost Center Verification app.
10
11

Technologies

Databricks
Prepares the data automatically.
Power BI
All the dashboards.
DAX & Power Query
Measures and data shaping.
PeopleSoft
Source of the financial data.
What I did
  • Built the Databricks data-processing layer.
  • Designed the single Power BI reporting model.
  • Wrote the DAX measures and built every dashboard screen.

Screenshots use sample data; real financial records are private.

12

GRANT DASHBOARDS

  • Replaced 1,074 recurring reports with one Power BI system.
  • Databricks now prepares the data automatically.
  • Reviewers go from the grant overview down to single transactions.
1,074reports replaced
2 days → autodata preparation
Visit the portfolio
website at:
sakina-saifuddin / works
36776
Cover